Office Market Pulse
Q1 2019
Welcome to our latest Office Market Pulse, your comprehensive guide to current activity and trends across all of the UK’s main office markets. We hope you find this research useful and encourage you to get in touch if you need any additional information.

Explore markets
Click on the location to find out more.

Take-up in the Cambridge office market in Q1 was in line with the long-term trend, totalling 87,399 sq ft, 3% below the 5-year average. Activity was significantly boosted by DisplayLink’s 62,000 sq ft lease of 22 Cambridge Science Park. The market saw 8 deals transacting with DisplayLink being the only one above 10,000 sq ft.
Although total availability remained broadly level compared to the final quarter of 2018, lack of grade A space particularly in the town centre remains the single constraining factor on take-up and is continuing to drive prime rental growth which has reached £42 per sq ft. The development pipeline remains limited with just 102,000 sq ft of speculative space being delivered this year across all markets.
Area Guide
Take-up (000s sq ft)
Q on Q
Prime rent (per sq ft)
Q1 2019
Q1 2018
PEAK
Y on Y
Years of supply
Y on Y

It seems that Brexit uncertainty has finally kicked in to the Central London occupational market as take-up over the first three months of 2019 fell by 33% quarter-on-quarter to 2.6m sq ft. Should this demand remain static for the year ahead then take-up would be just over 10.5m sq ft and some 3m sq ft below last year and 3.5m sq ft below the ten-year average.
While take-up numbers look weak, supply is still falling and is now at 13.5m sq ft (equivalent to one year of supply). Choice in some micro markets of London is scarce and this is assisting with rents being maintained and in some areas growing from the 2018 levels. A total of 650,000 sq ft in Q1 2019 was completed (refurbished/newly built) with 6.5m sq ft scheduled for delivery during the year. Whilst 14m sq ft is currently under construction, 56% is already pre let suggesting that the market can absorb new space during the next 18 months due to limited supply of quality stock.
Area Guide
Take-up (000s sq ft)
Q on Q
Prime rent (per sq ft)
Q1 2019
Q1 2018
PEAK
Y on Y
Years of supply
Y on Y

With only three deals seen in Q1 2019, the market remains subdued. However, Plexus Law’s lease of 7,000 sq ft at the newly refurbished Hyatt Place set a new headline rent of £27.50 per sq ft. There are several requirements currently in the Chelmsford market, but they remain below the 10,000 sq ft mark.
Chelmsford has not had grade A supply delivered to the market for several years, with the last development taking place in 2015. While this is unlikely to change in the short term, several buildings have been identified for refurbishment.
Area Guide
Take-up (000s sq ft)
Q on Q
Prime rent (per sq ft)
Q1 2019
Q1 2018
PEAK
Y on Y
Years of supply
Y on Y

The only significant Q1 letting has been the 18,000 sq ft letting at Titan Court, Hatfield Business Park, to Engie, relocating from Waltham Abbey. With the amount of available space diminishing in most of the A1(M) office centres, supply has been boosted by the launch of The Production Hall, an 60,000 sq ft office refurbishment of a listed building within a spectacular mixed-use scheme on the former Cereal Convertors site.
On the M1 corridor, the biggest news has been the announcement of an innovative management agreement of the 700,000 sq ft / 75 acre Croxley Business Park between Watford Borough Council and current owners Columbia Threadneedle. Regus took the final 20,000 sq ft in the newly developed Building 2 at the end of 2018, and plans for a further 85,000 sq ft of new offices are understood to being brought forward.
Area Guide
Take-up (000s sq ft)
Q on Q
Prime rent (per sq ft)
Q1 2019
Q1 2018
PEAK
Y on Y
Years of supply
Y on Y

Albeit no significant transactions have completed in the first quarter of the year, there has been a positive increase in occupier activity with a number of active requirements and deals under offer anticipated to complete in the next quarter.
More supply is due to come to the market on Capability Green and competition on the business park has meant stable rental levels with increased incentives to secure tenants. This favourable dynamic for occupiers means it offers arguably some of the best quality stock with excellent connectivity within the North M25 and M1 market.
In a market where there is real disparity between the quality of product on offer, we believe that where landlords speculatively refurbish to a high standard they will benefit from a material advantage over the competition.
Area Guide
Take-up (000s sq ft)
Q on Q
Prime rent (per sq ft)
Q1 2019
Q1 2018
PEAK
Y on Y
Years of supply
Y on Y

The only significant Q1 letting has been the 18,000 sq ft letting at Titan Court, Hatfield Business Park, to Engie, relocating from Waltham Abbey. With the amount of available space diminishing in most of the A1(M) office centres, supply has been boosted by the launch of The Production Hall, an 60,000 sq ft office refurbishment of a listed building within a spectacular mixed-use scheme on the former Cereal Convertors site.
On the M1 corridor, the biggest news has been the announcement of an innovative management agreement of the 700,000 sq ft / 75 acre Croxley Business Park between Watford Borough Council and current owners Columbia Threadneedle. Regus took the final 20,000 sq ft in the newly developed Building 2 at the end of 2018,
Area Guide
Take-up (000s sq ft)
Q on Q
Prime rent (per sq ft)
Q1 2019
Q1 2018
PEAK
Y on Y
Years of supply
Y on Y

After a strong level of take-up in 2018 which was in excess the 10 year average, although primarily due to the Leavesden Park deal to Asos, the first quarter of the year has been subdued with only a single notable transaction of c. 4,000 sq ft.
It is difficult to tell whether macroeconomic conditions or the passing of the demand surge caused by Permitted Development has led to the slowdown in take-up, but it is clearly evident that the severe lack of Grade A supply has hampered the Watford market.
Watford could be a market to watch in the next 2 years as a notable amount of Grade A supply is set to be delivered including a new building at Croxley Park and 53 Clarendon Road. Headline rents have been stagnant for the past 12 months or so and we anticipate the new supply to give the market a well needed boost.
Area Guide
Take-up (000s sq ft)
Q on Q
Prime rent (per sq ft)
Q1 2019
Q1 2018
PEAK
Y on Y
Years of supply
Y on Y

The only significant Q1 letting has been the 18,000 sq ft letting at Titan Court, Hatfield Business Park, to Engie, relocating from Waltham Abbey. With the amount of available space diminishing in most of the A1(M) office centres, supply has been boosted by the launch of The Production Hall, an 60,000 sq ft office refurbishment of a listed building within a spectacular mixed-use scheme on the former Cereal Convertors site.
On the M1 corridor, the biggest news has been the announcement of an innovative management agreement of the 700,000 sq ft / 75 acre Croxley Business Park between Watford Borough Council and current owners Columbia Threadneedle. Regus took the final 20,000 sq ft in the newly developed Building 2 at the end of 2018, and plans for a further 85,000 sq ft of new offices are understood to being brought forward.
Area Guide
Take-up (000s sq ft)
Q on Q
Prime rent (per sq ft)
Q1 2019
Q1 2018
PEAK
Y on Y
Years of supply
Y on Y

Total take-up for the quarter was 194,000 sq ft which was 31% ahead of the same quarter last year. Not only did Q1 2019 outperform Q1 2018, it delivered the second highest take-up figure for that quarter since records began. In fact, it was only beaten by an anomalous Q1 2016 which yielded a whopping 284,000 sq ft. Major deals for the quarter were 72,000 sq ft let to the Commonwealth Games organising committee at 1 Brindley Place and 46,000 sq ft let to law firm Irwin Mitchell at The Colmore Building.
The actual number of deals done (25) was the second lowest Q1 total since 2009 and whilst this might typically be a cause for concern in terms of being a barometer for the full year performance, there are some very large lettings in the pipeline. Both BT and We Work have live requirements that total c200,000 sq ft so the 2019 total should be in line with the long term average at the very least.
Area Guide
Take-up (000s sq ft)
Q on Q
Prime rent (per sq ft)
Q1 2019
Q1 2018
PEAK
Y on Y
Years of supply
Y on Y

Area Guide
Take-up (000s sq ft)
Q on Q
Prime rent (per sq ft)
Q1 2019
Q1 2018
PEAK
Y on Y
Years of supply
Y on Y

Area Guide
Take-up (000s sq ft)
Q on Q
Prime rent (per sq ft)
Q1 2019
Q1 2018
PEAK
Y on Y
Years of supply
Y on Y

Area Guide
Take-up (000s sq ft)
Q on Q
Prime rent (per sq ft)
Q1 2019
Q1 2018
PEAK
Y on Y
Years of supply
Y on Y

Area Guide
Take-up (000s sq ft)
Q on Q
Prime rent (per sq ft)
Q1 2019
Q1 2018
PEAK
Y on Y
Years of supply
Y on Y

Unlike the UK’s political climate the Leeds office market has not seen uncertainty mute the demand for office space. Take-up in the city centre exceeded 220,000 sq ft in Q1 2019, the strongest quarterly performance since the GPU’s record breaking hub acquisition in 2017. Standout deals included Link Asset Services acquisition of 71,288 sq ft Central Square together with WYG plc long-awaited move to 3 Sovereign Square in the South Bank. The performance of the office market beyond Q1 is likely be restricted due to the lack of availability of grade A office space, this is particularly evident within the out-of-town office market where supply is restricting the market.
Area Guide
Leeds is the UK’s fastest growing city and is the main driver of a city region with a £56 billion economy, a combined population of 3 million and a workforce of 1.5 million
It is the largest centre outside London for financial and business services. Over the next ten years, the economy is forecast to grow by 25% with financial and business services set to generate over half of GVA growth over that period
Leeds has the most diverse economy of the all the UK’s main employment centres and has seen the fastest rate of private sector jobs growth of any UK city
Source: Leeds City Council
Take-up (000s sq ft)
Q on Q
Prime rent (per sq ft)
Q1 2019
Q1 2018
PEAK
Y on Y
Years of supply
Y on Y

Following what was a record breaking 2018, Central Manchester’s office market recorded an encouraging first quarter of take-up reaching 314,733 sq ft and therefore on course to reach 1m sq ft-plus for a sixth consecutive year. This 1st quarter reflects a positive start to what is consistently a steady period of activity at the beginning of the calendar year and even more impressive given the backdrop of uncertainty.
The largest deal was the 47,465 sq ft pre-let of 2 New Bailey to Eversheds Sutherland, with the English Cities Fund office currently under construction and another large pre-let for the city centre market. In total, there were 61 transactions completed in Q1, other notable deals included co-working company Hucktree taking a 25,800 sq ft pre-let at the Express Building in what is there first Manchester operation and Moneysupermarket.com completing on 22,684 at No.1 Spinningfields at what is a new headline rent for the city centre at £35.00 per sq ft.
The large pre-lets continues the trend from 2018 and the ongoing demand for Grade A New Build options within the city centre, with a strong pipeline of new office development throughout 2019 and 2020 we envisage more of the same moving forward into this year.
Area Guide
The UK’s largest sub-regional economy outside of London, with a GVA of £56bn
Significant financial and business services sector, accounting for 27% of Greater Manchester’s total GVA in 2012
Current fastest travel time of 128 minutes to London by train, which will reduce by up to 60 minutes following the delivery of HS2 Phase II
Manchester is home to the UK’s largest university and Europe’s largest student population. This generates 30,000 graduates annually, providing a continuous supply of skilled labour and constantly stimulating innovation in the science, R&D and cultural sectors
Take-up (000s sq ft)
Q on Q
Prime rent (per sq ft)
Q1 2019
Q1 2018
PEAK
Y on Y
Years of supply
Y on Y

Take-up for the North East office market totalled 215,087 sq ft in the first quarter of 2019. Despite further uncertainty surrounding the UK’s political climate, the North East out-of-town market performed extremely well with the volume of space acquired totalling 198,488 sq ft. This was the 2nd best quarter for a number of years, and some 33% above the five year average. Noteworthy transactions included Biz Spaces’ 37,000 sq ft acquisition of Amber Court, Galliford Try’s move to Team Valley Trading Estate and Utility Alliance’s 11,465 acquisition at The Lightbox, Quorum Business Park.
The city centre take-up figures were mitigated by the lack of available stock, but with three speculative 100,000 sq ft grade A office schemes coming forward over the next few years, and various refurbishment schemes currently under way, we forecast a steady increase in take-up for the remainder of 2019.
Area Guide
Take-up (000s sq ft)
Q on Q
Prime rent (per sq ft)
Q1 2019
Q1 2018
PEAK
Y on Y
Years of supply
Y on Y

HSBC moved into their new 140,000 sq ft offices at Grosvenor House as part of the Heart of the City scheme in Q1.
11,647 sq ft of Grade A office space on the first floor of Acero Works was let in Q1; reducing availability at Acero to just 13,912 sq ft and leaving Grade A space in the city in greater demand than ever.
Prime office rents have seen a slight increase to £25.00 per sq ft, however given the shortage of supply this is expected to increase further throughout 2019.
Area Guide
The third largest English district by population at 1.5m, with a GVA of £11bn
Significant public and not-for-profit sector, accounting for 28% of the city’s total GVA in 2012
Current fastest travel time of 125 minutes to London by train, which will reduce by up to 46 minutes following the delivery of HS2 Phase II
Take-up (000s sq ft)
Q on Q
Prime rent (per sq ft)
Q1 2019
Q1 2018
PEAK
Y on Y
Years of supply
Y on Y

Take-up in the city centre totalled 106,000 sq ft in Q1. Key deals included FM Works’ 15,372 sq ft lease at The Reform Club and Clockwork’s 32,000 sq ft lease at Edward Pavillion.
Headline rents have moved towards £24.00 per sq ft, and even ‘trendy’ warehouse space in Baltic Triangle is achieving rents of £20.00 per sq ft on smaller space. New space is likely to be at the £25.00 per sq ft level when built.
Area Guide
Take-up (000s sq ft)
Q on Q
Prime rent (per sq ft)
Q1 2019
Q1 2018
PEAK
Y on Y
Years of supply
Y on Y

Take-up in Edinburgh for Q1 2019 was 206,000 sq ft, broadly similar to the previous quarter of 215,000 sq ft showing the Edinburgh market remains resilient despite uncertainty surrounding Brexit. Activity comprised some decent sized larger transactions with the number of deals actually falling from 65 to 42. The biggest lettings were Amazon taking 31,364 sq ft at Exchange Crescent and EPIC Games letting 10,122 sq ft at Quartermile 2. The most active sector by some margin was TMT.
New grade A supply continues to diminish with all buildings under construction either wholly or partially pre-let. Only 2 Semple Street 39,347 sq ft remains as the only immediately available new Grade A building in Edinburgh.
The dynamics remain positive in Edinburgh for further rental growth with prime rents now £35.00 per sq ft.
Area Guide
Take-up (000s sq ft)
Q on Q
Prime rent (per sq ft)
Q1 2019
Q1 2018
PEAK
Y on Y
Years of supply
Y on Y

Q1 take-up is around 105,000 sq ft which is lower than the same period in 2018, which included a pre-let. When removing said pre-let, the figure this year was around 30,000 sq ft, so the market saw an improvement. Key Q1 deals included Gamma Telecom at 2 West Regent Street (16,000 sq ft), with demand for Sub 5,000 sq ft offices remaining strong and accounting for the majority of transactions. There is currently around 300,000 sq ft under offer in the city centre.
In the Northern and Eastern Periphery, Q1 take-up was 8,372 sq ft, a slight decrease on 2018. Prime rents remained at £14.50 per sq ft. In the South and Western Periphery, Q1 take-up (18,605 sq ft) also decreased (25,000 sq ft) compared with 2018, and top rents increased to £17.50 per sq ft. In the latter, there is a lack of stock which has impacted take-up.
Grade A supply remains limited, with only one new development on site, Atlantic Square (90,000 sq ft) due for completion in Q3 2020. Refurbishments of buildings are ongoing and additional space is expected to come online in late 2019/early 2020.
Area Guide
Take-up (000s sq ft)
Q on Q
Prime rent (per sq ft)
Q1 2019
Q1 2018
PEAK
Y on Y
Years of supply
Y on Y

The Blackwater Valley office market has seen a good start to 2019 with 64,359 sq ft of take-up in Q1. Currently under offer there is a further 44,000 sq ft of offices so first half take-up should be in excess of 100,000 sq ft.
This will be getting close to the total take of 108,000 sq ft in 2018.
The significant transaction in Q1 has been the 43,000 sq ft let to Discover Financial at the refurbished Ascent 3 at Farnborough Aerospace centre. The headline rent was £28.00 per sq ft.
Further refurbished office space coming into the market this year will be the 69,000 sq ft Ascent 1and 30,000 sq ft 2 Watchmoor Park.
Area Guide
Take-up (000s sq ft)
Q on Q
Prime rent (per sq ft)
Q1 2019
Q1 2018
PEAK
Y on Y
Years of supply
Y on Y

Office supply has dropped to 515,429 sq ft in Q1 if which just 197,382 sq ft is Grade A.
Take-up in Q1 was 28,630 sq ft of which 18,750 sq ft was Grade A quality. Two of these lettings, eteach (6,300 sq ft) at 1 Arlington Square and Suse Software (7,187 sq ft) at One Station Square were on fitted space achieving £28 per sq ft and £24.50 per sq ft respectively.
Save for the sale of Worldwide House (49,801 sq ft) to Audatex in Q4, there remains a lack of larger occupational transactions, which is probably due to the lack of prime office supply.
The refurbishment of 2 The Arena (68,000 sq ft), which is expected to be complete in Q2/Q3 2019 will be very welcome in a market lacking in prime workspace.
Area Guide
Take-up (000s sq ft)
Q on Q
Prime rent (per sq ft)
Q1 2019
Q1 2018
PEAK
Y on Y
Years of supply
Y on Y

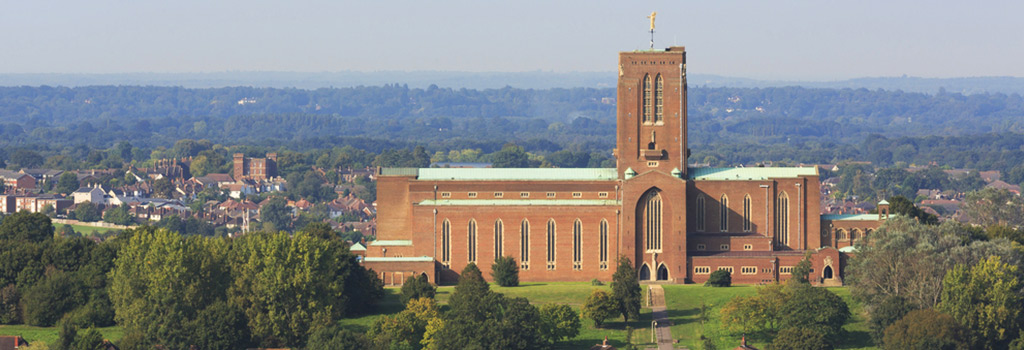
The Guildford office market has seen a promising start to the year with 21,626 sq ft transacted in Q1 2019. However, more interesting following behind this take-up is a further 60,000 sq ft of offices currently under offer.
Therefore we expect to see the 2018 total of 61,000 sq ft easily overtaken by the end of Q2 2019.
Key to the strong take performance expected over the first six months of this year is the tech sector and in particular the continuing growth of the computer games developers.
Prime rents are moving upwards with £35.00 per sq ft expected to be achieved by the end of Q2.
Two new buildings will be arriving in the town centre market in Q2; the 43,000 sq ft 255 High Street and the 29,000 sq ft Riverworks. Both will offer contemporary exposed services offices.
Area Guide
Take-up (000s sq ft)
Q on Q
Prime rent (per sq ft)
Q1 2019
Q1 2018
PEAK
Y on Y
Years of supply
Y on Y

Take-up has been steady if unspectacular in Heathrow through 2018 and into 2019. Sentiment has improved, however, with circa 70,000 sq ft of interest that should feed into the remainder of the year. Heathrow is also benefitting materially from the better provision of parking, tempting occupiers from nearby town centres which suffer from limited parking options.
Aside from the two major refurbishments at Stockley Park, there has been little new construction at Heathrow and availability is becoming tight. Grade A supply is currently at its lowest level in five years.
As a result of shrinking supply, prime headline rents have been steadily increasing to reach £39.00 per sq ft and reflective of recent at the newly refurbished buildings. Although rents are yet to hit £40.00 per sq ft, this level could be breached later in 2019.
Area Guide
Take-up (000s sq ft)
Q on Q
Prime rent (per sq ft)
Q1 2019
Q1 2018
PEAK
Y on Y
Years of supply
Y on Y

Take-up for this quarter was 27,000 sq ft, which remains robust, but consisted of mainly secondary office lettings. Smaller enquiries in the sub 5,000 sq ft Maidenhead have remained stable despite economic uncertainty. Whilst larger enquiries are slightly down Maidenhead remains a strong commercial market for corporate occupiers.
Total supply in Q1 2019 increased from 450,000 to 563,000 sq ft, with 4 existing buildings coming back to the market. The majority of this additional space is the town centre, increasing town centre availability to 28% of total supply. Ahead of Crossrail’s arrival, several town centre regeneration schemes have also commenced (The Landing, York Road, and Chapel Arches Phase 3) together with a new 565 space car park planned at Vicus Way near the Station.
Area Guide
Take-up (000s sq ft)
Q on Q
Prime rent (per sq ft)
Q1 2019
Q1 2018
PEAK
Y on Y
Years of supply
Y on Y

Office supply stands at 90,829 sq ft in Q1 of which 78,503 sq ft is Grade A quality. The main Grade A supply being 4 The Sector (27,168 sq ft) and Swan House (19,000 sq ft) both on Newbury Business Park, the latter being currently under offer.
There was only one letting in Q1 being 6,362 sq ft in Benyon House to Sovereign Housing Association.
Area Guide
Take-up (000s sq ft)
Q on Q
Prime rent (per sq ft)
Q1 2019
Q1 2018
PEAK
Y on Y
Years of supply
Y on Y

The Oxfordshire market continues at a steady pace, with strong and consistent activity from the science and technology sectors leading to a reduced grade A supply. Occupiers are now vying for remaining space, which will lead to further rental growth in 2020 when development picks up across the area.
Area Guide
Take-up (000s sq ft)
Q on Q
Prime rent (per sq ft)
Q1 2019
Q1 2018
PEAK
Y on Y
Years of supply
Y on Y

Greater Reading supply increased to 1,671,462 sq ft to the end of Q1 (from 1,477,531 sq ft Q4 2018) due to Veritas bringing 152,986 sq ft of tenant space to the market on Green Park and Spear Street Capital’s impending refurbishment of TVP1 (73,108 sq ft) on Thames Valley Park.
In the town centre market, there is 655,946 sq ft office space available (down from 1.1m sq ft in 2016), of which 576,814 sq ft is Grade A.
Out-of-town, the Grade A vs Grade B dynamic is rather different with 1,015,516 sq ft available of which only 306,947 sq ft is Grade A – hence Mapletree’s decision to break ground on building 400 and 450 Longwater Avenue at Green Park (235,000 sq ft).
Q1 take-up in the town centre was just 18,205 sq ft compares to 165,541 sq ft out-of-town. The largest transaction out-of-town was LSH’s freehold acquisition of Hive 3 (58,117 sq ft) at Arlington Business Park on behalf of Bottomline Technologies.
Area Guide
Take-up (000s sq ft)
Q on Q
Prime rent (per sq ft)
Q1 2019
Q1 2018
PEAK
Y on Y
Years of supply
Y on Y

Despite a drop in enquiries levels this quarter, Slough continues to show strong demand with 15,000 sq ft of take-up in Q1 2019. This follows a record year for take-up in 2018 with 320,000 sq ft. against at 10 year average of 120,000 sq ft. Supply remains stable at 757,500 sq ft. slightly up on Q4 as a result of 2 small grade B properties being brought to market. Rents have reached a premium at £37.00 per sq ft in the town centre following the latest Q4 letting in the Porter Building, with out-of-town market reaching £30.00 on Bath Road Central.
Area Guide
Take-up (000s sq ft)
Q on Q
Prime rent (per sq ft)
Q1 2019
Q1 2018
PEAK
Y on Y
Years of supply
Y on Y

Staines has endured two successive years of subdued take-up, reflecting a combination of stiff competition from neighbouring Thames Valley markets and a limited choice of sizeable grade A options. Development prospects are limited currently, with the office pipeline confined to an element of the Charter Square mixed-use scheme.
Staines is competing with other Thames Valley areas that have seen stronger activity in recent years. Prime headline rents have the potential to edge higher from their current level of £35.50 per sq ft as the last remnants of grade A supply are taken up. However, rents will not move on significantly until new space is delivered to the market.
Area Guide
Take-up (000s sq ft)
Q on Q
Prime rent (per sq ft)
Q1 2019
Q1 2018
PEAK
Y on Y
Years of supply
Y on Y

Despite the delivery of Charter House in 2015, the Uxbridge market has been challenged by lack of big ticket deals over the past five years. With significant grade A space remaining available, landlords have had to adopt creative approaches in order to compete for occupier demand.
The current prime headline rent of £36.00 per sq ft is unlikely to be surpassed in 2019, but we expect rents to move upwards from 2020 onwards as supply reduces.
Area Guide
Take-up (000s sq ft)
Q on Q
Prime rent (per sq ft)
Q1 2019
Q1 2018
PEAK
Y on Y
Years of supply
Y on Y

The office market in Milton Keynes continues to be buoyant in comparison to a number of south east markets, with c. 70,000 sq ft of take-up in the first quarter and an increase of active occupier requirements.
Delivery of better quality supply has sparked a flight to quality from tenants seeking contemporary workspace with amenities, in a market historically oversupplied with lesser quality stock. Supply continues to reduce and this is becoming increasingly pronounced for Grade A offices, in particular out-of-town.
The out-of-town office market has performed very well in the past 12 months, with the first quarter continuing in this vein across the size ranges. With only approx. 20,000 sq ft Grade A accommodation available out-of-town we anticipate rental growth to continue, whilst in Central Milton Keynes where a number of options are available we may start to see a reverse trend with inward movement from occupiers.
Area Guide
Take-up (000s sq ft)
Q on Q
Prime rent (per sq ft)
Q1 2019
Q1 2018
PEAK
Y on Y
Years of supply
Y on Y

Take-up in Q1 has increased 272% when comparing the Q1 of 2018 to 2019. Of this increase, 87% has been out-of-town transactions totalling 64,801 sq ft. In comparison, only 18,565 sq ft was transacted out-of-town within the first quarter of 2018.
In conjunction with the increased transactional activity, Q1 has also seen a sharp increase in the number of enquires (61) in comparison first and last quarters of 2018 (49 & 50 enquiries respectively) – a 25% and 22% increase accordingly.
Compared to Q4 2018, requirements for 20,000 sq ft plus have seen a 33% increase in enquiries over 20,000 sq ft. We are also aware that there are a number of transactions which will be completing within Q2 of 2019 that are plus 10,000 sq ft, supporting this data collected and highlighting the fact that transactions of this size are still taking place where there is available stock.
It is notable that quoting headline rents are now at £24.50 per sq ft at One Dorset Street in Southampton, and £22.50 per sq ft at Lakeside in Portsmouth. The increases being driven by lack of supply of Grade A space, and increased demand.
Area Guide
Take-up (000s sq ft)
Q on Q
Prime rent (per sq ft)
Q1 2019
Q1 2018
PEAK
Y on Y
Years of supply
Y on Y

The Greater Bristol office market saw a slow start to 2019 with total take-up of 154,005 sq ft for the first quarter. However, with continued low supply and the uncertainties surrounding BREXIT causing companies to delay decision making this was only to be expected. The city centre in particular saw a slow start to the year with take-up of 58,141 sq ft from 16 deals. The out-of-town market was above the 5 yearly average and transacted 95,864 sq ft from 13 deals. There was a lack of larger deals in the city centre with just one deal in excess of 5,000 sq ft but the out-of-town market saw 3 deals in excess of 10,000sq ft.
City centre rents have remained unchanged this quarter but this is largely due to supply issues, not demand, as there is a lack of stock that is able to push rents over and above the existing prime of £34.50 per sq ft. However the out-of-town market secured a new record rent of £23.50 per sq ft when Elbit Systems secured 12,760sq ft at 600 Aztec West.
Area Guide
Take-up (000s sq ft)
Q on Q
Prime rent (per sq ft)
Q1 2019
Q1 2018
PEAK
Y on Y
Years of supply
Y on Y

With 2018 take-up totaling just over 500,000 sq ft, a take-up of 151,097 sq ft for Cardiff in Q1 2019 can be considered a strong start. Take-up has generally been weaker in H1 with the bulk of transactions concluded in the final quarter of the previous year.
Crucially though, supply continues to fall which may limit take-up for the rest of 2019. Only 1 million sq ft of office space remains available, with only 643,000 sq ft in the city centre. With Sky leasing the final 40,000 sq ft at 4 Capital Quarter, there is no new available space currently under construction
Proposed developments such as Central Quay on the old Brains Brewery site and the Interchange at Central Square need to be delivered for Cardiff to continue to develop as a city as well as proposed major refurbishments to Hodge House on St Mary Street and Longcross on Newport Road to be delivered later this year. We are witnessing growing demand for serviced / semi-serviced and flexible space with new operators entering this arena in Cardiff resulting in increased competition to traditional / institutional Landlords.
Prime rents remain at £25.00 per sq ft, though will likely rise when new developments are brought to the market.
Area Guide
Take-up (000s sq ft)
Q on Q
Prime rent (per sq ft)
Q1 2019
Q1 2018
PEAK
Y on Y
Years of supply
Y on Y

Following a strong final quarter, Q1 has seen a healthy take-up of 34,000 sq ft this was largely driven by local housing association Pobl taking 18,000 sq ft space at Epona House. Take-up this quarter was up considerably up on Q1 2018 (c.5000sq ft) the strongest Q1 since 2014. The appetite for out-of-town stock continues, Q1 split 80% out-of-town to 20% city centre compared to an average of 70-30.
Supply has dipped slightly to 197,000 sq ft and the severe lack of grade A stock remains a concern. There are a number of large active requirements in the market yet insufficient quality stock to satisfy these. Good quality refurbished rents are creeping up to £11.00 per sq ft. Prime rents remain stable at £14.50 per sq ft.
A couple of developments are starting to appear in the pipeline, Swansea Council’s digital district incorporating 100,000 sq ft offices on the site of the former Oceana nightclub. Construction work is due to start on a student development Mariner Street car park housing 750 students due for completion Q3 2020.
Area Guide
Take-up (000s sq ft)
Q on Q
Prime rent (per sq ft)
Q1 2019
Q1 2018
PEAK
Y on Y
Years of supply
Y on Y

At 106,799sq ft, activity in the opening quarter of 2019 was healthy. While take-up was down 60% year-on-year, this is within the context of an outstanding opening quarter in 2018. There was a lack of large deals in Q1 2019, with the largest deals the 31,969 sq ft letting at Eagle Star House to an undisclosed occupier and Neueda’s letting of the redeveloped West Tower at Lanyon Plaza.
Although volume of grade A and B space take-up was evenly split in Q1, occupier demand for grade A space continues. Overall availability dwindled, but grade A availability increased by 5% year-on-year. While speculative development remains limited, construction has commenced on the 73,000 sq ft Mercantile building at Donegall Square South and Belfast Harbour Commissioners have indicated they will commence City Quays 3 (180,000 sq ft) in April 2019.
We are anticipating that demand will remain strong into Q2, and looking further into 2019. The Belfast office market has been particularly resilient to the political challenges and confidence amongst current occupiers remains strong.
With a number of new office developments poised to begin and demand consistent, we expect that prior commitment from potential tenants will be forthcoming to initiate some of the large new build schemes, such as Belfast Waterside (former Sirocco Quays), Olympic House and The Sixth.
Area Guide
Take-up (000s sq ft)
Q on Q
Prime rent (per sq ft)
Q1 2019
Q1 2018
PEAK
Y on Y
Years of supply
Y on Y

Area Guide
Take-up (000s sq ft)
Q on Q
Prime rent (per sq ft)
Q1 2019
Q1 2018
PEAK
Y on Y
Years of supply
Y on Y

While historically activity levels have been low in this prime area of London, this quarter saw some notable transactions take place confirming that tenants are still wanting to take super quality product and pay for this. In addition, with lease events looming a number of large occupiers seeking 25,000 sq ft + such as Lazards and Apollo are having to consider committing to pre-lets in order to satisfy their requirements due to acute shortagtes of stock. This could see some move away from the core in order to seek quality space. Notable deals were at Cassini House in St James’s Street, where Shore Capital leased 13,600 sq ft at £105.00 per sq ft and 13,100 sq ft taken by Exodus at 20 St James’s Street at £115.00 per sq ft. The largest transaction saw Glencore sign a pre let at GPE’s 18-19 Hanover Square taking 54,000 sq ft at £116.00 per sq ft. We have now increased our rents from £110.00 to £115.00 per sq ft.
Area Guide
Take-up (000s sq ft)
Q on Q
Prime rent (per sq ft)
Q1 2019
Q1 2018
PEAK
Y on Y
Years of supply
Y on Y

It seems that Brexit uncertainty has finally kicked in to the Central London occupational market as take-up over the first three months of 2019 fell by 33% quarter-on-quarter to 2.6m sq ft. Should this demand remain static for the year ahead then take-up would be just over 10.5m sq ft and some 3m sq ft below last year and 3.5m sq ft below the ten-year average.
While take-up numbers look weak, supply is still falling and is now at 13.5m sq ft (equivalent to one year of supply). Choice in some micro markets of London is scarce and this is assisting with rents being maintained and in some areas growing from the 2018 levels. A total of 650,000 sq ft in Q1 2019 was completed (refurbished/newly built) with 6.5m sq ft scheduled for delivery during the year. Whilst 14m sq ft is currently under construction, 56% is already pre let suggesting that the market can absorb new space during the next 18 months due to limited supply of quality stock.
Area Guide
Take-up (000s sq ft)
Q on Q
Prime rent (per sq ft)
Q1 2019
Q1 2018
PEAK
Y on Y
Years of supply
Y on Y
The traditional office district within the city centre
Comprising predominantly listed, period, smaller floor plate buildings within the conservation area
Latterly a number of new build and refurbished buildings providing modern grade A offices
Popular with the professional services, legal and accounting sectors given its close proximity to the city centre Railway Station and Law Courts
Key occupiers:
Stats
Built stock (sq ft)
| Built stock |
| 982,069 |
Availability (sq ft)
| Under construction | Grade A | Grade B/C |
| 66,392 | 70,752 | 211,383 |
Take-up (sq ft)
| Grade A | Grade B/C | |
| Q1 2019 | 88,541 | 19,157 |
| Last 12 months | 224,794 | 92,339 |
Prime rent
| Prime rent £ per sq ft |
| £30.00 |
Contact information
| Adam Varley | Rachel Vickers |
| T: 0113 887 6706 | T: 0113 887 6708 |
| E: avarley@lsh.co.uk | E: rvickers@lsh.co.uk |
Stats
Built stock (sq ft)
| Built stock |
| 1,154,339 |
Availability (sq ft)
| Under construction | Grade A | Grade B/C |
| 56,000 | 12,305 | 155,707 |
Take-up (sq ft)
| Grade A | Grade B/C | |
| Q1 2019 | 13,233 | 3,308 |
| Last 12 months | 37,609 | 32, 671 |
Prime rent
| Prime rent £ per sq ft |
| £ 26.00 |
Contact information
| Adam Varley | Rachel Vickers |
| T: 0113 887 6706 | T: 0113 887 6708 |
| E: avarley@lsh.co.uk | E: rvickers@lsh.co.uk |
Historically the manufacturing heartland of Leeds, where the original Railway Station terminated
This part of the city is an emerging office location as brownfield sites have been transformed and larger floor plate buildings have been developed, leading to a shift in the corporate occupiers’ footprint in the city centre
Key occupiers:
Stats
Built stock (sq ft)
| Built stock |
| 1,119,303 |
Availability (sq ft)
| Under construction | Grade A | Grade B/C |
| 135,915 | 24,466 | 211,136 |
Take-up (sq ft)
| Grade A | Grade B/C | |
| Q1 2019 | 5,660 | 3,350 |
| Last 12 months | 138,238 | 16,242 |
Prime rent
| Prime rent £ per sq ft |
| £29.00 |
Contact information
| Adam Varley | Rachel Vickers |
| T: 0113 887 6706 | T: 0113 887 6708 |
| E: avarley@lsh.co.uk | E: rvickers@lsh.co.uk |
Historic textiles and manufacturing district within the city centre
Schemes like Holbeck Urban Village, Brewery Wharf, Leeds Dock and Sovereign Square have transformed this area into a multi-cultural, mixed-use location
The area is popular with the Creative and TMT sectors clustering around ‘The Calls’ and Holbeck Urban Village where listed, former industrial buildings have been refurbished to quirky, modern offices
Like the West End, a number of larger floor plate buildings have been developed, attracting national and international corporate occupiers
Key occupiers:
Stats
Built stock (sq ft)
| Built stock |
Availability (sq ft)
| Under construction | Grade A | Grade B/C |
Take-up (sq ft)
| Grade A | Grade B/C | |
| Last 12 months |
Prime rent
| Prime rent £ per sq ft |
Contact information
| Adam Varley | Rachel Vickers |
| T: 0113 887 6706 | T: 0113 887 6708 |
| E: avarley@lsh.co.uk | E: rvickers@lsh.co.uk |
Historic textiles and manufacturing district within the city centre
Schemes like Holbeck Urban Village, Brewery Wharf, Leeds Dock and Sovereign Square have transformed this area into a multi-cultural, mixed-use location
The area is popular with the Creative and TMT sectors clustering around ‘The Calls’ and Holbeck Urban Village where listed, former industrial buildings have been refurbished to quirky, modern offices
Like the West End, a number of larger floor plate buildings have been developed, attracting national and international corporate occupiers
Key occupiers:
Stats
Built stock (sq ft)
| Built stock |
| 3,190,424 |
Availability (sq ft)
| Under construction | Grade A | Grade B/C |
| 38,634 | 19,423 | 228,157 |
Take-up (sq ft)
| Grade A | Grade B/C | |
| Q1 2019 | 26,738 | 61,333 |
| Last 12 months | 54,358 | 85,988 |
Prime rent
| Prime rent £ per sq ft |
| £ 28.50 |
Contact information
| Adam Varley | Rachel Vickers |
| T: 0113 887 6706 | T: 0113 887 6708 |
| E: avarley@lsh.co.uk | E: rvickers@lsh.co.uk |
Located close to the universities and LGI Hospital
The location houses the majority of Leeds City Council’s offices
Historically the location was the city’s financial district. However the majority of the office buildings have been converted to alternative uses to compliment the areas emerging leisure destination
The location still remains popular with contact centre occupiers given its proximity to the universities, transport hubs and retail district
Key occupiers:
Stats
Built stock (sq ft)
| Built stock |
| 1,137,023 |
Availability (sq ft)
| Under construction | Grade A | Grade B/C |
| – | – | 111,637 |
Take-up (sq ft)
| Grade A | Grade B/C | |
| Q1 2019 | – | 998 |
| Last 12 months | – | 11,451 |
Prime rent
| Prime rent £ per sq ft |
| £ 25.00 |
Contact information
| Adam Varley | Rachel Vickers |
| T: 0113 887 6706 | T: 0113 887 6708 |
| E: avarley@lsh.co.uk | E: rvickers@lsh.co.uk |
NOMA is a 20 acre regeneration of Manchester urban land which is owned by The Co-operative Group and Hermes Real Estate. NOMA is Creating a mixed-use location. The Co-operative have already located their headquarters within this area. Victoria train station is also undergoing a refurbishment to accommodate the Ordsall Cord.
Key occupiers:
Stats
Built stock (sq ft)
| Built stock |
| 914,181 |
Availability (sq ft)
| Under construction | Grade A | Grade B/C |
| – | 74,681 | 17,238 |
Take-up (sq ft)
| Grade A | Grade B/C | |
| Q1 2019 | – | – |
| Last 12 months | 89,449 | – |
Prime rent
| Prime rent £ per sq ft |
| £29.50 |
Contact information
| Josh Levy | Andrew Gardiner | Matt Pickersgill |
| T: 0161 242 7061 | T: 0161 242 7036 | T: 0161 242 7055 |
| E: jlevy@lsh.co.uk | E: agardiner@lsh.co.uk | E: mpickersgill@lsh.co.uk |
The Central Business District remains a very popular area of Manchester for businesses to locate. King Street is home to high end retailers, restaurants and high specification offices. The pull of Spinningfields has had little impact on the take up within the prime core due to its attractive surroundings.
Key occupiers:
Stats
Built stock (sq ft)
| Built stock |
| 1,962,955 |
Availability (sq ft)
| Under construction | Grade A | Grade B/C |
| 250,946 | 114,632 | 163,661 |
Take-up (sq ft)
| Grade A | Grade B/C | |
| Q1 2019 | – | 20,350 |
| Last 12 months | 73,934 | 93,523 |
Prime rent
| Prime rent £ per sq ft |
| £34.00 |
Contact information
| Josh Levy | Andrew Gardiner | Matt Pickersgill |
| T: 0161 242 7061 | T: 0161 242 7036 | T: 0161 242 7055 |
| E: jlevy@lsh.co.uk | E: agardiner@lsh.co.uk | E: mpickersgill@lsh.co.uk |
Spinningfields was developed in 2000s as a business, retail and residential development of Manchester located between Deansgate and the River Irwell. The area totals approximately 430,000 sq ft of mixed use space. The area is highly desirable for businesses due to its large floorplates, high specification and local amenities. Consequently it achieves some of the highest rents in Manchester.
Two new developments are currently underway called No 1 Spinningfields and the XYZ Building
Key occupiers:
Stats
Built stock (sq ft)
| Built stock |
| 1,683,793 |
Availability (sq ft)
| Under construction | Grade A | Grade B/C |
| 154,091 | 185,857 | 25,380 |
Take-up (sq ft)
| Grade A | Grade B/C | |
| Q1 2019 | 63,575 | – |
| Last 12 months | 70,911 | 20,772 |
| Prime rent £ per sq ft |
| £35.00 |
Contact information
| Josh Levy | Andrew Gardiner | Matt Pickersgill |
| T: 0161 242 7061 | T: 0161 242 7036 | T: 0161 242 7055 |
| E: jlevy@lsh.co.uk | E: agardiner@lsh.co.uk | E: mpickersgill@lsh.co.uk |
The 1996 Manchester bombing forced Manchester to redevelop its retail core. It saw unpopular 1960s buildings being replaced with modern attractive developments which did wonders for Manchester retail reputation.
Recent years have seen office buildings undergo refurbishment and businesses are now happy to locate within the area and it’s no longer perceived as a solely retail district.
Key occupiers:
Stats
Built stock (sq ft)
| Built stock |
| 733,196 |
Availability (sq ft)
| Under construction | Grade A | Grade B/C |
| – | – | 130,480 |
Take-up (sq ft)
| Grade A | Grade B/C | |
| Q1 2019 | – | 18,174 |
| Last 12 months | 8,203 | 78,864 |
Prime rent
| Prime rent £ per sq ft |
| £22.50 |
Contact information
| Josh Levy | Andrew Gardiner | Matt Pickersgill |
| T: 0161 242 7061 | T: 0161 242 7036 | T: 0161 242 7055 |
| E: jlevy@lsh.co.uk | E: agardiner@lsh.co.uk | E: mpickersgill@lsh.co.uk |
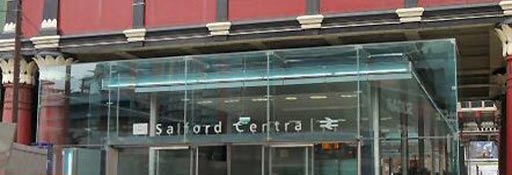
Historically Salford was not seen as a desirable location for businesses. However the development of One New Bailey and 101 The Embankment has put Salford on the business map. Further developments are expected to commence in 2016/2017.
The train station is also undergoing an extension to accommodate the Ordsall Chord which will see trains from London pass through the station.
Key occupiers:
Stats
Built stock (sq ft)
| Built stock |
| 810,712 |
Availability (sq ft)
| Under construction | Grade A | Grade B/C |
| 305,088 | 76,542 | 51,458 |
Take-up (sq ft)
| Grade A | Grade B/C | |
| Q1 2019 | 63,575 | – |
| Last 12 months | 210,668 | 28,706 |
Prime rent
| Prime rent £ per sq ft |
| £29.50 |
Contact information
| Josh Levy | Andrew Gardiner | Matt Pickersgill |
| T: 0161 242 7061 | T: 0161 242 7036 | T: 0161 242 7055 |
| E: jlevy@lsh.co.uk | E: agardiner@lsh.co.uk | E: mpickersgill@lsh.co.uk |
Stats
Built stock (sq ft)
| Built stock |
| 623,583 |
Availability (sq ft)
| Under construction | Grade A | Grade B/C |
| – | – | 108,663 |
Take-up (sq ft)
| Grade A | Grade B/C | |
| Q1 2019 | – | 3,844 |
| Last 12 months | 1,162 | 15,647 |
Prime rent
| Prime rent £ per sq ft |
| £23.50 |
Contact information
| Josh Levy | Andrew Gardiner | Matt Pickersgill |
| T: 0161 242 7061 | T: 0161 242 7036 | T: 0161 242 7055 |
| E: jlevy@lsh.co.uk | E: agardiner@lsh.co.uk | E: mpickersgill@lsh.co.uk |
Castlefield is an inner city conservation area of Manchester. It was the site of the Roman era fort of ‘Mancunium’ which means Manchester. The area comprises a mix commercial and residential converted mills which overlook Manchester’s canal system. The area is very popular with creative companies as well as young professionals who have plenty of bars to choose from on the canalside.
Stats
Built stock (sq ft)
| Built stock |
| 210,858 |
Availability (sq ft)
| Under construction | Grade A | Grade B/C |
| – | – | 7,649 |
Take-up (sq ft)
| Grade A | Grade B/C | |
| Q1 2019 | – | – |
| Last 12 months | – | 18,837 |
Prime rent
| Prime rent £ per sq ft |
| £20.00 |
Contact information
| Josh Levy | Andrew Gardiner | Matt Pickersgill |
| T: 0161 242 7061 | T: 0161 242 7036 | T: 0161 242 7055 |
| E: jlevy@lsh.co.uk | E: agardiner@lsh.co.uk | E: mpickersgill@lsh.co.uk |
The Knowledge district is home to Manchester’s largest universities; Manchester University and Manchester Metropolitan University. The area, which is where graphene was discovered, also includes Manchester Science Park. Since the relocation of the BBC to MediaCity Bruntwood and their JV partner Select Property Group are in the midst of developing Circle Square which is a mixed-use development that offers office, retail, serviced apartments and private residential accommodation.
Stats
Built stock (sq ft)
| Built stock |
| 55,670 |
Availability (sq ft)
| Under construction | Grade A | Grade B/C |
| 161,000 | – | 31,427 |
Take-up (sq ft)
| Grade A | Grade B/C | |
| Q1 2019 | – | – |
| Last 12 months | – | 37,510 |
Prime rent
| Prime rent £ per sq ft |
| £16.00 |
Contact information
| Josh Levy | Andrew Gardiner | Matt Pickersgill |
| T: 0161 242 7061 | T: 0161 242 7036 | T: 0161 242 7055 |
| E: jlevy@lsh.co.uk | E: agardiner@lsh.co.uk | E: mpickersgill@lsh.co.uk |
The majority of this area was occupied by Granada TV and so it saw little commercial activity. Now that ITV relocated to MediaCity the 25 acre site is to undergo redevelopment to create a new neighbourhood which will include commercial buildings, 2,400 residential units, leisure and retail opportunities. The scheme is due to commence Q4 2016.
Key occupiers:
Stats
Built stock (sq ft)
| Built stock |
| 472,487 |
Availability (sq ft)
| Under construction | Grade A | Grade B/C |
| – | 99,072 | 15,409 |
Take-up (sq ft)
| Grade A | Grade B/C | |
| Q1 2019 | 5,935 | 14,057 |
| Last 12 months | 5,935 | 32,110 |
Prime rent
| Prime rent £ per sq ft |
| £35.00 |
Contact information
| Josh Levy | Andrew Gardiner | Matt Pickersgill |
| T: 0161 242 7061 | T: 0161 242 7036 | T: 0161 242 7055 |
| E: jlevy@lsh.co.uk | E: agardiner@lsh.co.uk | E: mpickersgill@lsh.co.uk |
The Northern Quarter remains Manchester’s quirkiest area. It is likened to Shoreditch due to its ‘rugged’ look and its housing of the creative occupiers. There is limited space within the Northern Quarter due to high demand. Independent coffee houses welcome one man bands and encourage collaboration between like minded individuals. The area is Manchester’s preferred choice for a night out due to its quirky nature.
Key occupiers:
Stats
Built stock (sq ft)
| Built stock |
| 482,049 |
Availability (sq ft)
| Under construction | Grade A | Grade B/C |
| 35,000 | – | 20,687 |
Take-up (sq ft)
| Grade A | Grade B/C | |
| Q1 2019 | – | 1,918 |
| Last 12 months | 13,600 | 57,264 |
Prime rent
| Prime rent £ per sq ft |
| £25.00 |
Contact information
| Josh Levy | Andrew Gardiner | Matt Pickersgill |
| T: 0161 242 7061 | T: 0161 242 7036 | T: 0161 242 7055 |
| E: jlevy@lsh.co.uk | E: agardiner@lsh.co.uk | E: mpickersgill@lsh.co.uk |
Stats
Built stock (sq ft)
| Built stock |
| 1,898,728 |
Availability (sq ft)
| Under construction | Grade A | Grade B/C |
| – | 72,635 | 75,283 |
Take-up (sq ft)
| Grade A | Grade B/C | |
| Q1 2019 | 6,842 | 15,723 |
| Last 12 months | 61,363 | 105,449 |
Prime rent
| Prime rent £ per sq ft |
| £27.50 |
Contact information
| Josh Levy | Andrew Gardiner | Matt Pickersgill |
| T: 0161 242 7061 | T: 0161 242 7036 | T: 0161 242 7055 |
| E: jlevy@lsh.co.uk | E: agardiner@lsh.co.uk | E: mpickersgill@lsh.co.uk |
Portland Street Corridor has enjoyed an active few years. It was once a forgotten part of Manchester city centre however it is now a sought after area for both creative occupiers and professional services. The area which includes China Town offers converted mills and plenty of character. There are several buildings along Portland Street which have recently traded and are now undergoing substantial refurbishment which will move the rents in this area on.
Key occupiers:
Stats
Built stock (sq ft)
| Built stock |
| 1,577,740 |
Availability (sq ft)
| Under construction | Grade A | Grade B/C |
| 64,000 | 56,153 | 200,095 |
Take-up (sq ft)
| Grade A | Grade B/C | |
| Q1 2019 | – | 22,120 |
| Last 12 months | 11,915 | 79,203 |
Prime rent
| Prime rent £ per sq ft |
| £28.00 |
Contact information
| Josh Levy | Andrew Gardiner | Matt Pickersgill |
| T: 0161 242 7061 | T: 0161 242 7036 | T: 0161 242 7055 |
| E: jlevy@lsh.co.uk | E: agardiner@lsh.co.uk | E: mpickersgill@lsh.co.uk |
This area has been vastly redeveloped in recent years. St Peter’s Square has enjoyed a remodelling as well as the development of two grade A offices. This area is also home to the Town Hall which has recently been refurbished.
The First Street development which encompasses ‘Home’ has become Manchester’s newest attraction and it still continues to grow with further commercial buildings planned.
Key occupiers:
Stats
Built stock (sq ft)
| Built stock |
| 1,457,542 |
Availability (sq ft)
| Under construction | Grade A | Grade B/C |
| 51,000 | 110,729 | 97,375 |
Take-up (sq ft)
| Grade A | Grade B/C | |
| Q1 2019 | 11,119 | 14,894 |
| Last 12 months | 118,034 | 120,066 |
Prime rent
| Prime rent £ per sq ft |
| £25.00 |
Contact information
| Josh Levy | Andrew Gardiner | Matt Pickersgill |
| T: 0161 242 7061 | T: 0161 242 7036 | T: 0161 242 7055 |
| E: jlevy@lsh.co.uk | E: agardiner@lsh.co.uk | E: mpickersgill@lsh.co.uk |
Stats
Built stock (sq ft)
| Built stock |
| 1,857,312 |
Availability (sq ft)
| Under construction | Grade A | Grade B/C |
| 295,566 | 65,925 | 167,675 |
Take-up (sq ft)
| Grade A | Grade B/C | |
| Q1 2019 | 16,272 | 13,476 |
| Last 12 months | 107,484 | 83,480 |
Prime rent
| Prime rent £ per sq ft |
| £33.50 |
Contact information
| Josh Levy | Andrew Gardiner | Matt Pickersgill |
| T: 0161 242 7061 | T: 0161 242 7036 | T: 0161 242 7055 |
| E: jlevy@lsh.co.uk | E: agardiner@lsh.co.uk | E: mpickersgill@lsh.co.uk |
Historically Ancoats was instrumental in the industrial revolution and has been called ‘the world’s first industrial suburb’. Since the 1990s Ancoats’ industrial heritage has been recognised and its proximity to the city centre has led to investment and substantial regeneration. Ancoats now comprises a number of listed mills which have undergone conversion into a mix of commercial and residential space.
Key occupiers:
Stats
Built Stock (sq ft)
| Built stock |
| 266,702 |
Availability (sq ft)
| Under construction | Grade A | Grade B/C |
| 50,000 | – | 23,913 |
Take-up (sq ft)
| Grade A | Grade B/C | |
| Q1 2019 | 25,800 | 2,209 |
| Last 12 months | 25,800 | 13,794 |
Prime Rent
| Prime Rent £ per sq ft |
| £19.50 |
Contact information
| Josh Levy | Andrew Gardiner | Matt Pickersgill |
| T: 0161 242 7061 | T: 0161 242 7036 | T: 0161 242 7055 |
| E: jlevy@lsh.co.uk | E: agardiner@lsh.co.uk | E: mpickersgill@lsh.co.uk |
The sub-district with the largest amount of built stock – over 1.5 million sq ft
Home of the largest office building in Sheffield – Griffin House/The Pennine Centre
Most historically significant sub-district with the highest proportion of listed buildings, including those built in the Victorian and Georgian eras
Key occupiers:
Stats
Built stock (sq ft)
| Built stock |
| 1,493,458 |
Availability (sq ft)
| Under construction | Grade A | Grade B/C |
| – | – | 43,133 |
Take-up (sq ft)
| Grade A | Grade B/C | |
| Q4 2018 | 1,100 | 4,300 |
| Last 12 months | 6,100 | 67,251 |
Prime rent
| Prime rent £ per sq ft |
| £12.00 |
Contact information
| Tom Burlaga | Max Williamson |
| T: 0114 270 2706 | T: 0114 270 2758 |
| E: tburlaga@lsh.co.uk | E: mwilliamson@lsh.co.uk |
Stats
Built stock (sq ft)
| Built stock |
| 792,019 |
Availability (sq ft)
| Under construction | Grade A | Grade B/C |
| – | 26,500 | 21,282 |
Take-up (sq ft)
| Grade A | Grade B/C | |
| Q4 2018 | 25,000 | 10,433 |
| Last 12 months | 39,000 | 12,133 |
Prime rent
| Prime rent £ per sq ft |
| £23.00 |
Contact information
| Tom Burlaga | Max Williamson |
| T: 0114 270 2706 | T: 0114 270 2758 |
| E: tburlaga@lsh.co.uk | E: mwilliamson@lsh.co.uk |
Stats
Built stock (sq ft)
| Built stock |
| 506,934 |
Availability (sq ft)
| Under construction | Grade A | Grade B/C |
| – | – | 5,291 |
Take-up (sq ft)
| Grade A | Grade B/C | |
| Q4 2018 | 15,000 | 1,900 |
| Last 12 months | 54,000 | 18,900 |
Prime rent
| Prime rent £ per sq ft |
| £21.00 |
Contact information
| Tom Burlaga | Max Williamson |
| T: 0114 270 2706 | T: 0114 270 2758 |
| E: tburlaga@lsh.co.uk | E: mwilliamson@lsh.co.uk |
The sub-district with the largest amount of grade A office space – over 500,000 sq ft
Home of Victoria Quays and Kelham Island Museum offering a reminder of Sheffield’s industrial heritage among modern commercial and residential buildings
Home of the largest grade A office building in Sheffield – Vulcan House
Key occupiers:
Stats
Built stock (sq ft)
| Built stock |
| 929,147 |
Availability (sq ft)
| Under construction | Grade A | Grade B/C |
| – | 8,193 | 49,397 |
Take-up (sq ft)
| Grade A | Grade B/C | |
| Q4 2018 | – | 15,000 |
| Last 12 months | – | 36,000 |
Prime rent
| Prime rent £ per sq ft |
| £14.50 |
Contact information
| Tom Burlaga | Max Williamson |
| T: 0114 270 2706 | T: 0114 270 2758 |
| E: tburlaga@lsh.co.uk | E: mwilliamson@lsh.co.uk |
Stats
Built stock (sq ft)
| Built stock |
| 573,112 |
Availability (sq ft)
| Under construction | Grade A | Grade B/C |
| – | 3,000 | 36,247 |
Take-up (sq ft)
| Grade A | Grade B/C | |
| Q4 2018 | – | – |
| Last 12 months | – | 4,000 |
Prime rent
| Prime rent £ per sq ft |
| £12.50 |
Contact information
| Tom Burlaga | Max Williamson |
| T: 0114 270 2706 | T: 0114 270 2758 |
| E: tburlaga@lsh.co.uk | E: mwilliamson@lsh.co.uk |
Stats
Built stock (sq ft)
| Built stock |
| 895,921 |
Availability (sq ft)
| Under construction | Grade A | Grade B/C |
| – | 24,000 | 85,116 |
Take-up (sq ft)
| Grade A | Grade B/C | |
| Q4 2018 | – | 8,850 |
| Last 12 months | – | 12,950 |
Prime rent
| Prime rent £ per sq ft |
| £11.00 |
Contact information
| Tom Burlaga | Max Williamson |
| T: 0114 270 2706 | T: 0114 270 2758 |
| E: tburlaga@lsh.co.uk | E: mwilliamson@lsh.co.uk |
Hertfordshire
Click on the location to find out more.

Thames Valley
Click on the location to find out more.

Central London
Click on the location to find out more.

Districts of Leeds
Click on each district to find out more

Districts of Manchester
Click on each district to find out more

Districts of Sheffield
Click on each district to find out more

Steady start to 2019
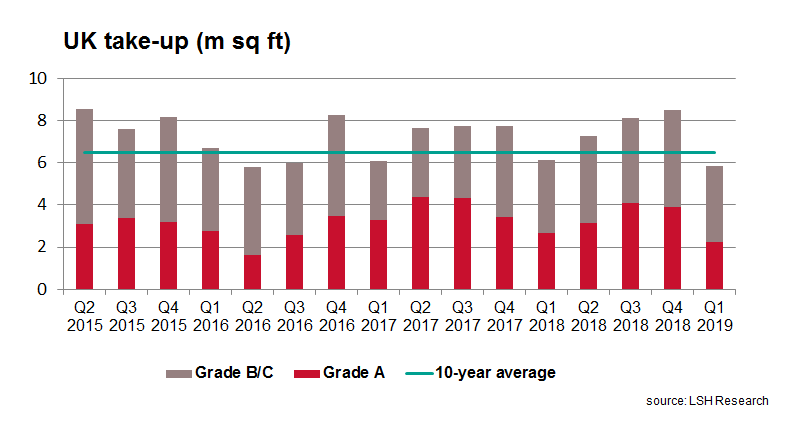
Take-up was relatively robust in Q1, particularly so given the heightened uncertainty posed by the run-up to the planned Brexit date in March. Total UK-wide take-up of 5.9m sq ft in Q1 was only 4% on the same period last year and down 10% on the ten-year quarterly average.
Subdued activity in Central London
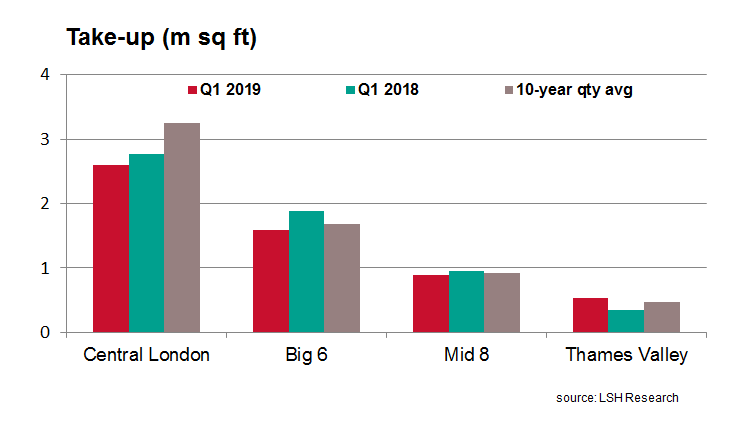
A key drag on overall take-up was Central London, which had its weakest quarter since Q2 2016. Take-up of 2.6m sq ft was 33% down on the previous quarter and 20% below the ten-year quarterly average. Midtown was the only key submarket to buck the trend, with take-up of almost 400,000 sq ft up 17% on the average. This was boosted by Sony Music’s 124,600 sq ft pre-let at Building S1, Handyside Street, King’s Cross, the largest deal in Q1.
Mixed activity across the Big Six
Collectively, the Big Six markets had a relatively subdued Q1 following strong levels of activity during 2018. At 1.6m sq ft, Q1 was the lowest take-up across the six markets since Q1 2017.
However, it was a mixed picture across the cities. Leeds had an outstanding start to the year, with city centre take-up exceeding 220,000 sq ft, its strongest quarterly performance since the GPU’s record-breaking pre-let in Q3 2017. Manchester also had an encouraging first quarter, with city centre take-up reaching 314,733 sq ft, up 11% on the ten-year average. Birmingham was home to the largest deal outside of London in Q1, namely the Commonwealth Games organising committee’s 72,000 sq ft lease at 1 Brindley Place. Meanwhile, Bristol city centre had a very quiet Q1, with take-up of 58,141 sq ft down 56% on the ten-year average.
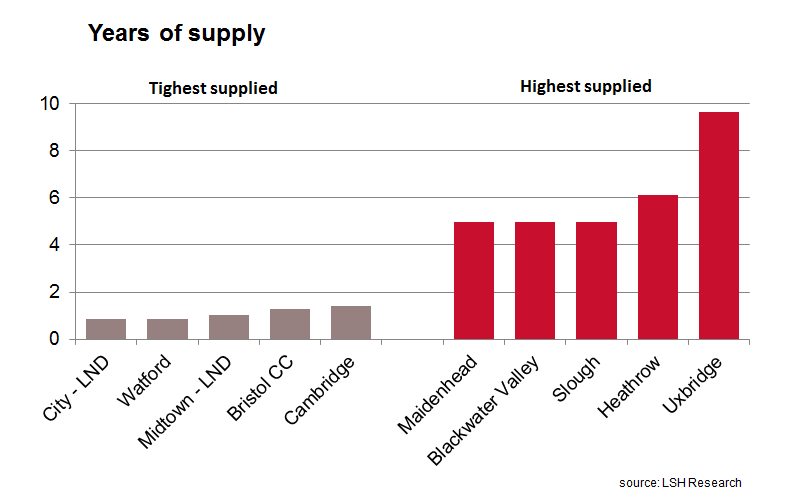
Supply at all-time low
UK-wide availability fell for the fourth consecutive quarter in Q1 to stand an historic low of 51.3m sq ft. UK-wide supply fell by only 1% on the previous quarter, driven by Central London where suppl fell by 4% over the quarter to stand at its lowest level since Q3 2016.
The majority of the Big Six markets recorded a fall in availability over the quarter. Following strong take-up, Leeds saw the sharpest reduction, down 17%. Edinburgh was the only Big Six market to see an uptick in supply as new developments near completion, although still stands well below trend level.
Despite on-going uncertainty around Brexit, speculative development in the regions increased since the beginning of the year to stand at 4.5m sq ft. This was boosted by major starts including 235,000 sq ft at 400 and 450 Longwater Avenue, Green Park in Reading, and 73,000 sq ft at the Mercantile building, Donegall Square South in Belfast.
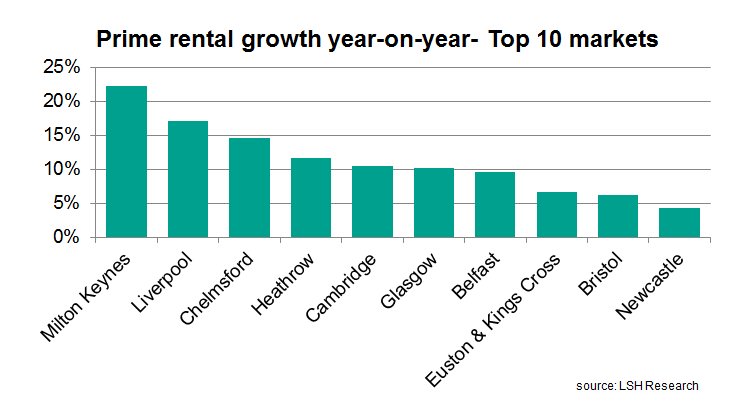
Tight supply maintains rental growth
Despite uncertainty in the market around Brexit, prime headline rents remained broadly steady in Q1, with a number of markets recording growth. This included Manchester, which achieved a new headline rent of £35.00 per sq ft following Moneysupermarket.com’s 22,684 sq ft lease at No.1 Spinningfields. In the South East, Oxford, Slough and Bracknell also saw upward movement in prime headline rents in Q1.
The tight levels of grade A supply should continue to support rental growth across the UK’s office markets over 2019 despite uncertainty in the market. With developers arguably more cautious of new starts in light of the on-going uncertainty, constrained levels of speculative development will to keep a relatively tight lid on supply and help support rental growth.
For more information contact Izzy Watterson, Senior Research Analyst.
Brexit bites
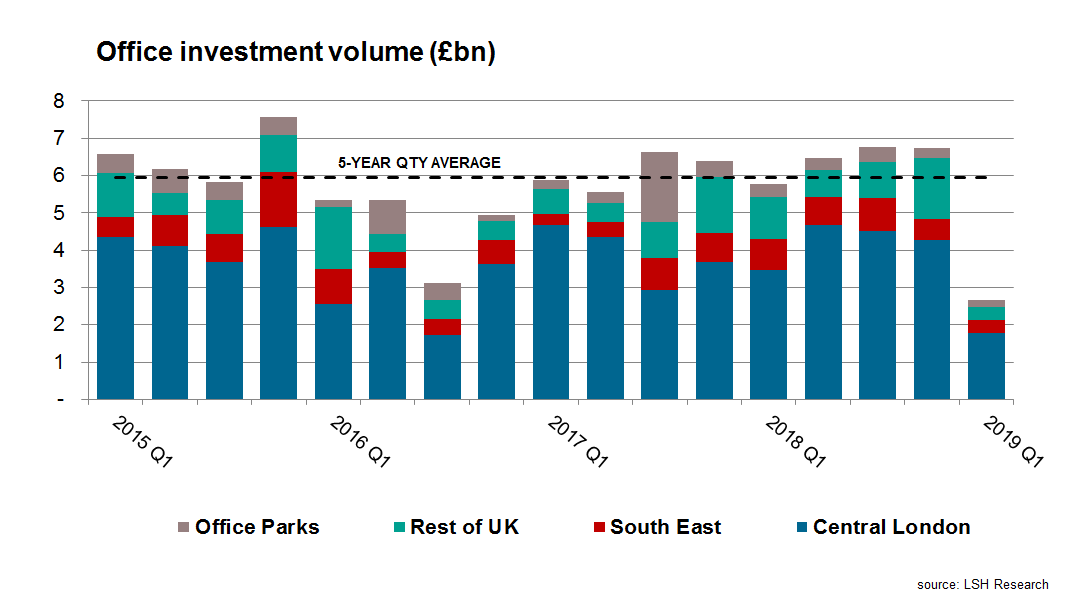
The market impasse around the planned lead-up to Brexit was clearly reflected in subdued volume. UK office volume was £2.7bn in Q1, slumping by 60% quarter-on-quarter and its lowest in almost ten years.
Subdued activity was evident across the three key office segments, although Central London was the main drag, with volume of £1.8bn less than half the five-year quarterly average. Only two Central London office deals above £100m changed hands in Q1, the largest deal being Dukelease Properties’ £121m (4.95% NIY) purchase of 42-47 Minories, EC3 from Harel Insurance.
Outside Central London, Rest of South East offices recorded volume of £337m, down 51% on the five-year quarterly average. This was due to the absence of large deals, while the smaller end of the market was more resilient. Similarly, Rest of UK offices recorded its lowest quarterly volume since Q2 2013, down 62% on the five-year quarterly average
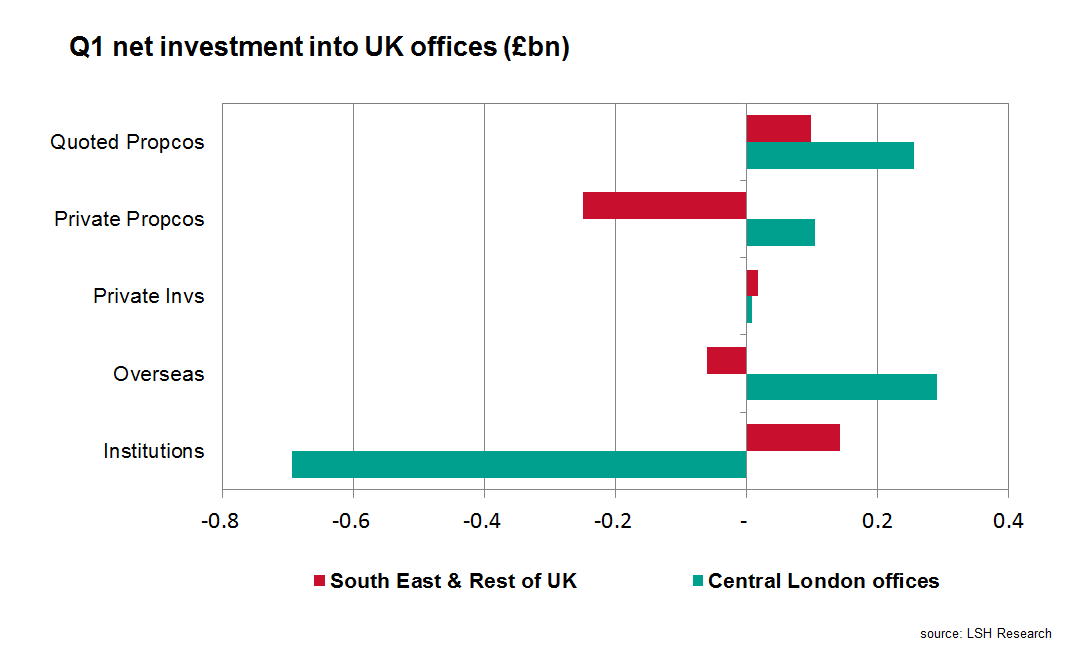
Overseas buyers very quiet
Weak investment in London was largely down to very cautious approach from overseas buyers. At £1.1bn, total overseas investment into UK offices was the lowest quarterly volume since Q1 2009 and 68% below the five-year quarterly average. That said, overseas investors remained the largest net investor of UK offices, to the tune of £227m in Q1.
At £309m, investment from institutions was also subdued in Q1, down 70% on the previous quarter and 63% below the five-year quarterly average. While their investment was weak across the subsectors, institutions were net buyers of regional offices.
Local authorities remained active during Q1, acquiring 14 assets with combined value of £104m. This was largely focused in the South East, where local authorities accounted for 24% of office investment. The largest deal was West Sussex County Council’s £21.75m purchase of 2 City Park, Hove reflecting 5.75% NIY.
South East prime yield hardens
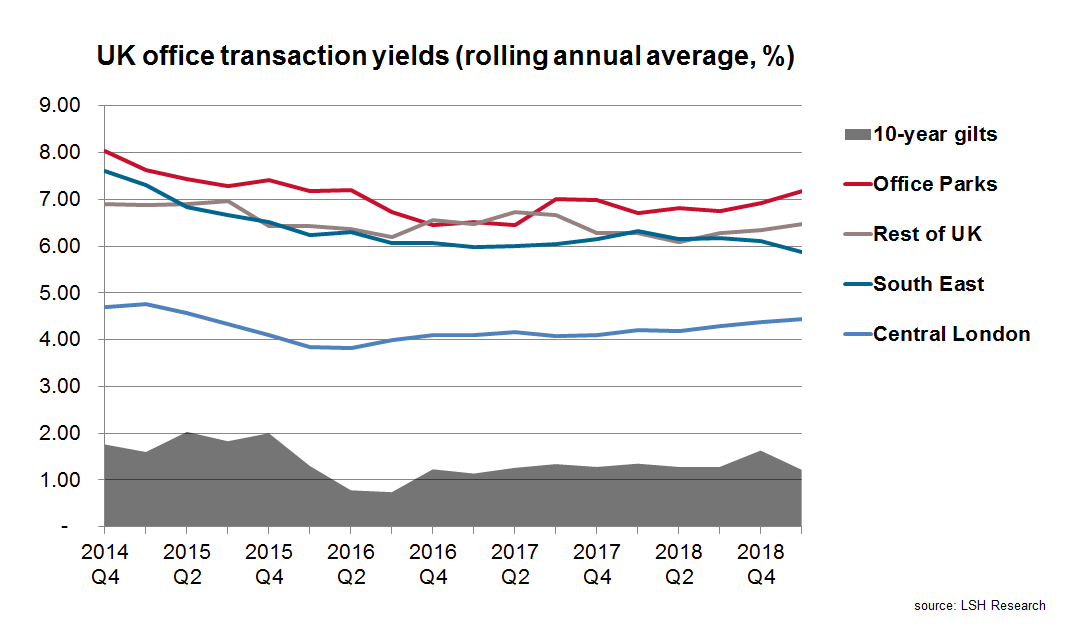
South East offices was the only key segment of the property market to witness a hardening of prime yields in Q1. This was confirmed St James’s Place PF’s £39m purchase of the Brinell Building, Brighton, which indicated that prime yields hardened by 25bps to 4.75%, the first inward movement in over four years. In contrast, the West End prime yield moved out by 25 bps to stand at 3.75%, its first outward movement since Q2 2016, following the referendum result.
Meanwhile, the All Office average transaction yield remained largely stable in Q1, but masked the diverging movements between the subsectors. South East offices moved inwards by 43 bps while Rest of UK Offices moved out by 34 bps.
Outlook
It was to be hoped that Q1 would be an isolated quarter and that greater clarity of Brexit would have emerged by now. While the UK did not crash out of the EU, the Brexit extension to October has left the UK in a prolonged period of uncertainty. Assuming some sort of clarity around Brexit does materialise, an uncertain summer is expected to be followed by a strong release of pent up demand and significant trading activity later in the year.
The early part of Q2 has already seen larger-scale office transactions than the first quarter. This may be an indication that investors cannot wait indefinitely, and an increased number of large deals may come through over the rest of the year. However, the extension of political and economic uncertainty means that there are downside risks to this, while the fundamentals of the UK office market are generally robust.
For more information contact Oliver du Sautoy, Head of Research
Contact Us
For enquiries about our research, please contact Oliver du Sautoy or Izzy Watterson.
For enquiries about the UK and Ireland office markets, please contact one of our experts or complete the form below.


